Analyzing VPC Flow Logs with CloudWatch and Athena
VPC Flow logs theory:
VPC Flow Logs capture IP traffic to and from network interfaces in your VPC. This can be useful in many circumstances, including:
- providing flow log data to CloudWatch to create alerts when anyone attempts to access one of your EC2 instances via SSH
- identifying the source IP addresses of port probes
- helping troubleshoot why specific traffic is not reaching an instance.
VPC Flow logs are used to capture information about IP traffic going in/out of your interfaces. It helps to monitor and troubleshoot connecitivity issues
Flow Logs can be configured at different levels:
- VPC Flow Logs
- Subnet Flow Logs
- ENI Flow Logs
Flow logs can be sent to:
- CloudWatch Logs
- an Amazon S3 bucket
- Kinesis Firehose in the same account
- Kinesis Firehose in a different account
Can capture network information from AWS managed ENIs such as: ELB, RDS, ElasticCache, Redshift, Amazon WorkSpaces.
Flow Logs Limitations:
Amazon VPC Flow Logs do not record traffic:
- To and from VPC-native DNS services
- Amazon EC2 metadata service
- Dynamic Host Configuration Protocol (DHCP) services
- Windows license activation server
Now the Configuration
Create a CloudWatch Log Group and a VPC Flow Log to CloudWatch
- Create a VPC flow log to S3, setting the Maximum aggregation interval to 1 minute and the S3 bucket ARN to the VPC Flow Logs S3 Bucket ARN found in S3.
The Default Format of the VPC Flog Logs is:
1
${version} ${account-id} ${interface-id} ${srcaddr} ${dstaddr} ${srcport} ${dstport} ${protocol} ${packets} ${bytes} ${start} ${end} ${action} ${log-status}
- In the CloudWatch section, create a CloudWatch log group. Name it VPCFlowLogs.
- Create a VPC flow log to CloudWatch using the correct IAM role and the CloudWatch log group that was just created in the previous step.
Create CloudWatch Filters and Alerts
- Create a CloudWatch log Metric filter:
You need to create the Metric filter in the Log Group created previously.
- Use the below filter pattern:
1
[version, account, eni, source, destination, srcport, destport="22", protocol="6", packets, bytes, windowstart, windowend, action="REJECT", flowlogstatus]
- Use the following for the log data:
1
2
3
4
2 086112738802 eni-0d5d75b41f9befe9e 61.177.172.128 172.31.83.158 39611 22 6 1 40 1563108188 1563108227 REJECT OK
2 086112738802 eni-0d5d75b41f9befe9e 182.68.238.8 172.31.83.158 42227 22 6 1 44 1563109030 1563109067 REJECT OK
2 086112738802 eni-0d5d75b41f9befe9e 42.171.23.181 172.31.83.158 52417 22 6 24 4065 1563191069 1563191121 ACCEPT OK
2 086112738802 eni-0d5d75b41f9befe9e 61.177.172.128 172.31.83.158 39611 80 6 1 40 1563108188 1563108227 REJECT OK
- Filter name:
dest-port-22-rejects - Metric namespace:
VPC Flow Logs - Metric name:
SSH Rejects - Metric value:
1
- Create an alarm:
You need to create the alarm SSH-rejects in the Metric filter created previously.
Configuration page 1
- Period:
1 minute - Threshold type:
Static - Define the alarm condition:
Greater/Equal - Define the threshold value:
1
Configuration page 2
- Alarm state trigger:
In alarm - Select Create new topic, add an emails and click on the Create topic button
Configuration page 3
- Alarm name:
SSH-rejects
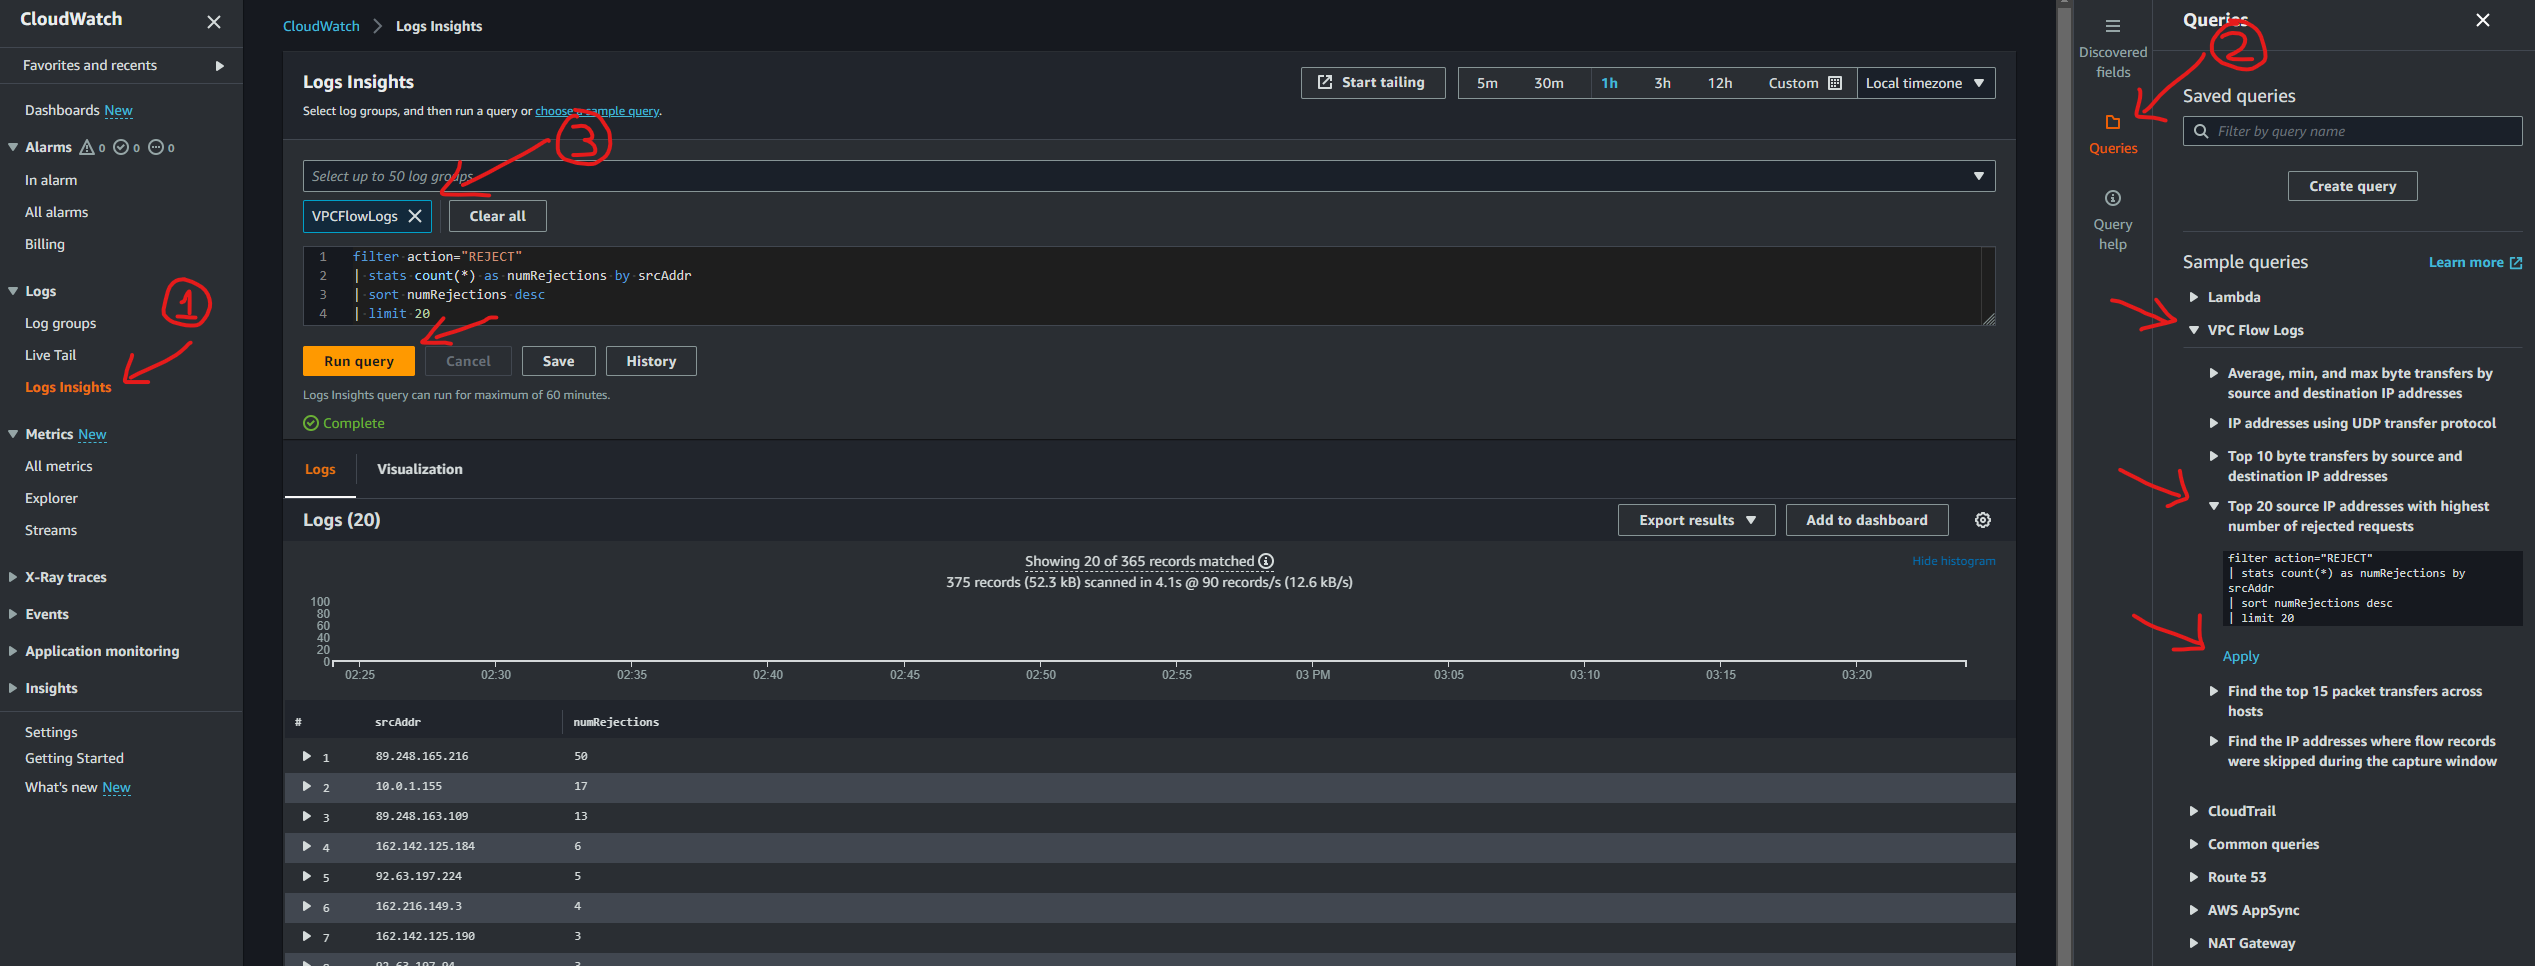
Use CloudWatch Logs Insights
Apply the Top 20 source IP addresses with highest number of rejected requests sample query.
In CloudWatch section,
- On the left side menu go to Logs > Logs Insights
- On the right side meni click on Quries, Sample Queries: VPC Flow Logs > Top 20 source IP addresses with highest number of rejected requests. Finally click on the Run query orange button on the main menu.
Analyze VPC Flow Logs Data in Athena
- Get the S3 URI of the Folder where the VPC FLow Logs are stored in S3
For example:
1
s3://cfst-3029-c720f5353835c72125eaa-vpcflowlogsbucket-smty3vug8yp8/AWSLogs/{account_id}/vpcflowlogs/us-east-1/2023/10/22/

In the Athena service. Create a Query result location using the S3 URI taken. Make sure that the trailing / is there.
Create the Athena table.
Use this SQL query.
Replace LOCATION with your own S3 URI up to /us-east-1/
1
2
3
4
5
6
7
8
9
10
11
12
13
14
15
16
17
18
19
20
21
CREATE EXTERNAL TABLE IF NOT EXISTS default.vpc_flow_logs (
  version int,
  account string,
  interfaceid string,
  sourceaddress string,
  destinationaddress string,
  sourceport int,
  destinationport int,
  protocol int,
  numpackets int,
  numbytes bigint,
  starttime int,
  endtime int,
  action string,
  logstatus string
)
PARTITIONED BY (dt string)
ROW FORMAT DELIMITED
FIELDS TERMINATED BY ' '
LOCATION 's3://{your_log_bucket}/AWSLogs/{account_id}/vpcflowlogs/us-east-1/'
TBLPROPERTIES ("skip.header.line.count"="1");
- Create partitions to be able to read the data:
Replace YYYY-MM-DD with the one in the S3 bucket
Replace s3://{your_log_bucket}/AWSLogs/{account_id}/vpcflowlogs/us-east-1/YYYY/MM/DD/ with the correct S3 URI
1
2
3
ALTER TABLE default.vpc_flow_logs
ADD PARTITION (dt='YYYY-MM-DD')
location 's3://{your_log_bucket}/AWSLogs/{account_id}/vpcflowlogs/us-east-1/YYYY/MM/DD/';
- Run the following query in a new query window:
1
2
3
4
5
6
7
8
9
10
11
12
SELECT day_of_week(from_iso8601_timestamp(dt)) AS
  day,
  dt,
  interfaceid,
  sourceaddress,
  destinationport,
  action,
  protocol
FROM vpc_flow_logs
WHERE action = 'REJECT' AND protocol = 6
order by sourceaddress
LIMIT 100;